Good morning…We’ve reached that part of the programming where we redraw TLINES and pretend we know NOW what they say about the future … ahead of CPI (after Biden’s speech yesterday, who ELSE is taking the OVER?) and today’s 10yr auction.
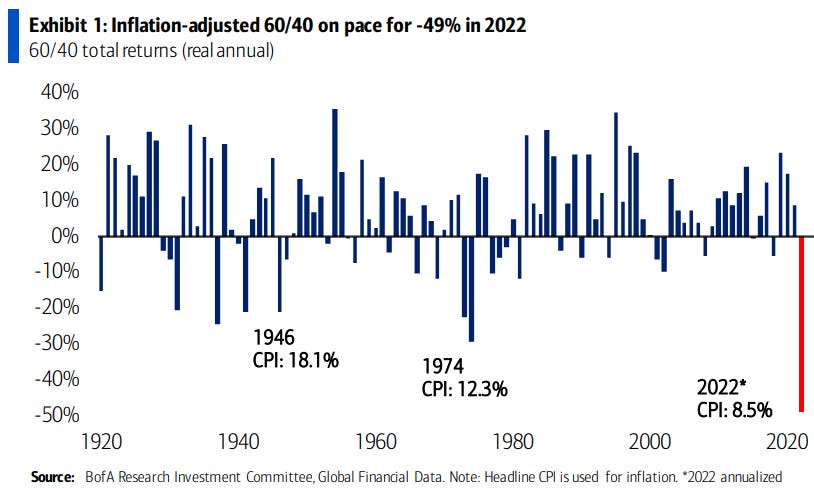
A Stellar 3Y Auction Stops Through With Record Low Dealer Takedownfollowed a TEPPER’d rally yesterday after Bostic affirmed 50bps hike Monday and here we are. BondBid3.0 on this CPI and 10yr auction day. With that in mind and on the heels of yesterday’s WSJ inspirational CoTD where pension funds about to get worse, is THIS ONE — from BAML — which may be of interest to any / all 60/40 managers and others contemplating this afternoons 10yr or tomorrows 30yr auction
… The end of 60/40: conventional asset allocations are on pace for their worst year in history (Exhibit 1) as bonds no longer hedge stocks (Exhibit 2).
Back TO the drawing board! But before we go there (or to ones economic workbench or {ECAN <GO>}), here is a snapshot OF USTs as of 710a:
… HEREis what another shop says be behind the price action, you know,
WHILE YOU SLEPT Treasuries are higher and the curve flatter out to 10's (where the shorts seem to be concentrated; see attachments) ahead of CPI. DXY is lower (-0.35%) while front WTI futures are higher this morning(+3.5%). Asian stocks were mostly higher (China's CSI 300 +1.44%), EU and UK share markets are all in the green (SX5E +1.9%, SX7E +2.1%) and ES futures are showing +1.1% here at 6:55am. Our overnight US rates flows saw a rangebound session during Tokyo's AM hours with Asian real$ selling 10's through 30's into the uptick. During London's morning our desk colleagues noted numerous rec swaps programs going through with banks buying 3's-5's on ASW. Overnight Treasury volume was decent at ~135% of average overall...
… and for some MORE of the news you can use » IGMs Press Picks for today (11 May) to help weed thru the noise (some of which can be found over here at Finviz).
With CPI straight ahead — thankfully we get a look at the data before having to take on more duration (10yy today at 1p), a few items which may help pass some time between 830a data and 1pm liquidity event.
CHARTS:
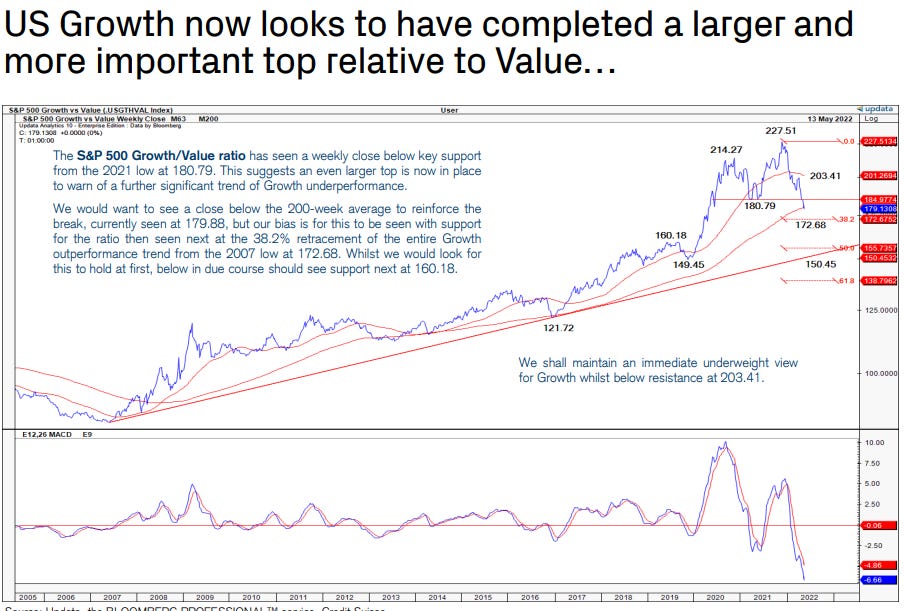
1stBOS’s US Equity Chartbook: The Value Test - Reviewing our core objectives for US Equities
And MORE from the 1stBOS CHARTS dept — weekly macro chartpack HERE
Today is all about consumer price inflation. Evidence so far is that transitory inflation has started to prove transitory—where goods prices rose on extraordinary demand, the monthly price changes are now showing disinflation and in some cases deflation. While there are higher wartime energy prices, this has created some demand destruction with budget-constrained consumers limiting non-energy spending, which may be another disinflation impulse for non-energy goods.
The US April consumer price data should show lower headline and core inflation in year-on-year terms. This measure says as much about the price level last year as it does about the price level this year. To date, the data has been telling investors about prices in a locked-down economy in 2021. Now it will start to tell investors about prices in a reopening economy in 2021.
Chinese consumer prices are a reminder of the very local nature of inflation. Covid restrictions have limited demand and, as service sector inflation slowed, pulled down the core number. Food, transport and household items were the only areas where inflation rose.
German final April consumer price inflation is due. This, however, is practically the only German data release that is almost never revised.
ROSIE offered an Early Morning with Dave (9th May),
Where to Hide? S&P 500 Puts, Natural Gas, and the U.S. Dollar
Included in this report on p8-9,
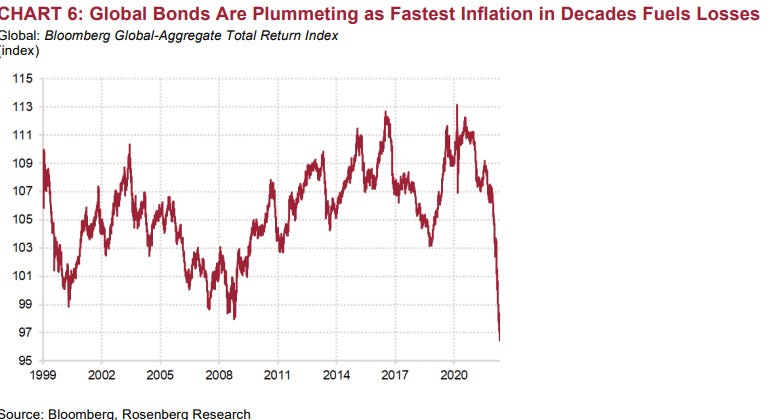
… Adding to the bond pressure is the hefty supply calendar this week — with $103 billion of freshlyminted 3-, 10-, and 30-year Treasuries hitting the market. The one thing about Treasuries is that the 10-year now offers a hefty near-170 basis point premium over the S&P 500 dividend (the norm is just above 100 basis points). The Australian bond market has completely fallen apart in the aftermath of last week's surprise RBA rate hike — up 9 basis points today to 3.56% for its 10-year bond; the one bond market that has hung in far better has been U.K. gilts with signs of a divided MPC and the forecast of recession by year-end (more below). The gilts market is outperforming as sterling slides a further 0.2% to $1.2319, the lowest it has been since June 2020 — and again, reflecting the “divergence” in one between the BoE (less hawkish) and the Fed (ever-more hawkish — maybe scared is the more relevant term — scared by the growing list of bond vigilantes who have come out in force after decades of hibernation).
… Our analysis suggests that bringing the labor market into better balance will likely require some increase in unemployment for several reasons. First, historical experience provides no examples of labor demand falling materially without unemployment rising. Second, there is significant heterogeneity in labor market tightness across sectors and geographies, which the Fed will not be able to target precisely. Third, early evidence from small businesses indicates that falling but still elevated job openings have been associated with a modest decline in employment…
And if you, like me, was wondering where MS rate strategy was this weekend, well, can you believe its time for mid-year updates?
Global Strategy Mid-Year Outlook: The Tempest The training wheels are still off and challenges continue. We see more equity de-rating, rangebound yields, and strength in oil, munis and mortgages. The US Agg outperforms the S&P 500.
Be patient as challenges continue: Valuation improves but slower growth and policy tightening persist. Late-cycle dynamics support light exposure, staying up in quality/liquidity, and RV. Turning points beckon in FX and EM, but not yet. Japan over US equities, MBS over credit, CAD and IDR over NZD and CNY, oil over metals. See Top Trades Across Asset Classes.
Global equities – more of the same: Falling PMI and earnings revisions mean the bear market is not finished. We see further de-rating and US weakness, while Japan outperforms. We continue to favor defensives and commodity producers. We see the S&P 500 at 3,900 by 2Q23.
G10 rates – toward terminal rates: We suggest a neutral stance on duration and see US 10-year yields trading around 3.0% through 2H22. Europe outperforms. Receive EUR 5y5y inflation, pay EUR 10y10y swap, and UST 10-year at 3.15% by 2Q23…
… In the US … the 2s10s yield curve inverting again as the Fed hikes rates further … Top trades: UST 2s10s flattener …
… 2022 has seen a lot. It’s seen the worst bond market performance since 1980, the biggest commodity outperformance since data began in 1960, and large moves within and between equity indices. It has seen a terrible conflict in Europe, a Covid crisis in China, and the first 50bp hike by the Federal Reserve in 22 years. It’s only May.
… If a recession is avoided, the risk is more straightforward. We’ve just lived through a 12-year period where all sorts of assets outperformed the economy as monetary policy was unusually loose. We could have a period where assets underperform the economy as policy support reverses. Assets/GDP is still high.
Check out the FULL report for ALL the firms rockstar analysts have to offer including Mike Wilson on stocks — MORE OF THE SAME.


