... and another thing(s), observed: "Bidless bond"; fiscal (follies)first; (economic)risks skewed to downside; shippings a hassle; (CCCs)canaries in the coalmine
Good morning / afternoon / evening - please choose whichever one which best describes when ever it may be that YOU are stumbling across this weekends note…
I promise this will NOT take long and is only a brief interruption to pass along a couple / few more things I’ve stumbled upon since YESTERDAYS UPDATE …
SOME (more) of THE (Sunday with French Open) VIEWS you might be able to use. A few things which stood out to ME this weekend from the inbox …
“Bidless bond” … romancing ‘23 highs and noted by THE bank of the land …
23 May 2025 BAML: Global Rates Weekly Slippery slope
The View: Supply pressures Next week’s 40y JGB auction in focus after the accelerated global bear steepening. We see steepening risks as most pronounced in the US and Japan.
Rates: Bidless bond US: Long-end selloff is top of mind for market & we think has room to persist. We maintain 10s30s steeper & 30y swap spread short.
The UST curve bear steepened as concerns around deficits & debt downgrade (see: US downgrade & US fiscal FAQ) met a sparse demand backdrop, particularly for the long end of the curve. Coming into the week, we flagged that prominent long positions moved out of the money and were vulnerable (see: Positioning lagging sentiment).
Our conviction across the curve remains strongest at the front and back end. In the front end, we hold our flatteners to position for fewer cuts this year and more next year (SFR Z5 – Z6) and we recommend paying July & December FOMC OIS. At the long end, we are in 10s30s steepeners and short 30y spreads. While market focus is squarely on the continued long end led selloff, we believe there is more room for this trade to perform (see US Volatility). US fiscal worries will likely accelerate as the House finalizes their bill & the Senate reduces the amount of spending cuts (see: No respite for the deficit).
Demand pullback from domestic investors We believe end-user demand for the long end is limited for three core reasons: 1/ pension & LDI bid appears to be cooling for now, 2/ the back end offers less diversification benefit, 3/ the distorted 20y point limits rolldown for the 30y.
Slowing LDI demand: While defined benefit (DB) private pension funds remain well funded according to the Milliman Index, de-risking flow into fixed income appears to be slowing (see: Real money steepener). We see evidence of this in cooling demand for stripped USTs (effectively longest sovereign duration asset is principal only 30y coupon). The most recent Milliman annual report also suggests that while pensions were very well funded last year, they did not increase fixed income allocations.
Milliman 100 pensions have been adding to fixed income for nearly two decades while the broader DB private pension universe has been adding more to equities and re-risking (Exhibit 5). The recent long-end selloff may eventually present opportunities for flows from this investor, though present volatility may keep demand at bay.
Lower diversification: Long end USTs have exhibited worse diversification value vs other parts of the curve (Exhibit 6). As multi-asset investors leverage USTs for diversification vs risky assets, they may be less inclined to extend out to the long end. We see examples of this in fund flows, active Agg investor positioning, and CFTC asset manager futures holdings which all reflect a skew towards steepener positioning.
Poor roll characteristics: While the curve is now largely upward sloping, the 30y bond rolldown yield is extremely unattractive driven by the cheapness of the 20y sector. 10y20y vs 30y yield differential is historically stretched (Exhibit 7). UST’s issuance at the 20y point is now likely cannibalizing demand for the long end at large…
Global investors have better options…
… August next opportunity for UST action…
…Technicals: US 30Y yield flirts with 2023 highs In line with our view, upside risk for US yields continued this week. Oscillators and averages remain in favor of this; however, the Oct-2023 highs are in the way.
…Intraday market actions this week pushed US 30Y yield near the head and shoulders target of 5.17% (high as of Thursday was 5.15%). This is right near the Oct 2023 highs and a precarious point. Could the long-term cycle be developing a double top? Or just a brief hesitation before the next leg higher to 5.33% follows? Our trend and momentum indicators still have an upward bias; however, the longer yield remains below the Oct 2023 highs, the greater the potential for a large double top is to form.
Can almost close yer eyes and see stratEgerists and analysts up in the box cobbling this first one together … some important thoughts / visual on JGBs for us inbetween matches and sets …
Curves are steepening around the world with a continued focus on fiscal measures and deteriorating supply–demand dynamics. We have started to move into contrarian flatteners in the JPY, in USTs and even in parts of EM, while we still like steepeners in the very back end of the EUR and KRW curves.
In FX, we expect a continued rotation out of US assets to weigh on the dollar. Sustained uncertainty around the outcome of trade negotiations is likely to remain an additional driver for USD weakness. We added USDJPY and USDKRW shorts last week.
High-frequency data indicates US equity outflows persist, with five out of six weeks of fund outflows since early April. While systematic funds have supported recent resilience, we still see much more room for further outflows from US equities given the large overweight from discretionary investors. Europe remains a strong candidate for repatriation.
… Fiscal comes first: Curves are steepening around the world with continued deterioration in supply–demand dynamics for bonds. JGBs particularly stand out and forward rates in the very back end are now trading wider than EUR and even USD. Since the beginning of 2024, net JGB-buying from life insurers has been at historic lows. In fact, some even turned net sellers in Q1 (Figure 1). This lack of demand from lifers was initially replaced by Trust banks (i.e. pension funds) that were actively rebalancing portfolios to buy JGBs, driven by JPY weakness and equity strength, but the latest data suggest these rebalancing flows from pension funds stalled in April (Figure 2), likely because of declines in US equities during the month, leaving the JGB market with a vulnerable supply–demand picture. Ultimately, the massive tail in the 20y auction was the main trigger for last week’s sell-off.
… and another Sunday (economic) special ahead of holiday shortened week …
May 25, 2025 MS Sunday Start | What's Next in Global Macro: Skewed to the Downside Seth B Carpenter
This week, we published our Economics and Strategy Mid-Year Outlooks, a semi-annual collaborative exercise across the Morgan Stanley Research department. We lay out our baseline views and assumptions, highlighting what we think is likely to happen, but also where we might be wrong. Given the current overhang of policy uncertainty, a point forecast is of dubious value. We hope to lay out a framework and an idea of the distribution of possible outcomes.
We see the imposition of tariffs by the US as an outsized, fundamental shock to the outlook. Recent conversations suggest clients are feeling comforted that uncertainty is subsiding, but we hasten to add that tariffs remain and are likely to stay much higher than at the start of the year. Announcements late last week of sharply higher tariffs on Europe show that the risks of elevated tariffs are far from gone. Most importantly, the slowdown from tariffs that have already been imposed has yet to manifest in the hard data.
We forecast global growth stepping down a full percentage point from 2024 to 2025, and a larger step-down in the US, from 2.5% 4Q/4Q last year to 1% this year. The risks to the global economy are probably asymmetric. A slowdown is likely despite the current de-escalation and even should we see a full reversal on tariffs, so the upside is limited. But a re-escalation could very easily tip the US – and the world – into recession.
The effects of the tariffs are heterogeneous across the world. Because the US is imposing the tariffs and they cover a broad range of imports, the step-down in real US GDP growth is paired with a boost to inflation. For the rest of the world, tariffs and slower US growth mostly mean softer aggregate demand, and thus slower growth with lower inflation. In our forecast, euro area growth never gets above 1%Y in any year of the forecast horizon, and inflation undershoots the ECB’s 2%Y target. In our forecast, China loses nearly half a percentage point of growth next year versus 2024, with deflation risks still entrenched. Japan's exports soften, but nominal GDP holds up, buoyed by resilient domestic consumption. India remains the standout in our coverage, with nearly 6% 4Q/4Q growth this year and stronger thereafter.
Monetary policy reflects the macro developments. In the US, because we see core PCE inflation reaccelerating over the second half of the year, we think the Fed stays on hold throughout 2025 and only begins cutting in early 2026 when inflation recedes. Put differently, it is only early next year that the slowdown in growth and risk to jobs will become a bigger problem for the Fed than inflation. In stark contrast, the ECB can cut below neutral this year because disinflation is set to continue, so it has more scope to offset weak activity and a stronger euro. The BoJ was on a hiking cycle, but we think hikes come to an end.
Against this complicated and still changing backdrop, one of the most common questions I got at our Japan Summit last week was about US market exceptionalism. Do slower US growth, episodically rising Treasury yields, and a volatile stock market mean USD assets are losing their safe-haven status?
We think no, at least for now. While global clients are reconsidering asset allocation, we do not see clear evidence that foreign investors are abandoning the US. The period of substantial outperformance may be over, but in the short run, it is difficult to imagine what the alternative will be for assets that make up such a large share of global investments. That said, the most recent downgrade of Treasuries is a reminder for markets that the situation continues to evolve, and fair value assessments will have to change over time.
… Moving along TO a few other curated links from the intertubes, which I HOPE you’ll find useful …
Shipping …
May 25, 2025 Apollo: No Rebound in US/China Container Traffic
It’s been nearly two weeks since the China/US trade deal, but container traffic from China to the US hasn’t shown a strong rebound, see chart below.
This raises the question: Are 30% tariffs on China still too high? Or are US companies simply waiting to see if tariffs will drop further before ramping up shipments?
Note: Displays the estimated number of container vessels departing China for the United States, focusing on dry cargo ships. Aggregates data using a 15-day moving average to reduce short-term volatility and to provide a clearer view of broader trends in vessel activity. Sources: Bloomberg, Macrobond, Apollo Chief Economist
… and with all due respect, I’m reminded of that sayin’, who ya gonna believe, ME or yer own lyin’ eyes … this witnessed a couple of weeks back … First coming in on a Tuesday evening …
… then, different boat leaving at / around 6am the next day …
JUNK, a canary in the coalmine …
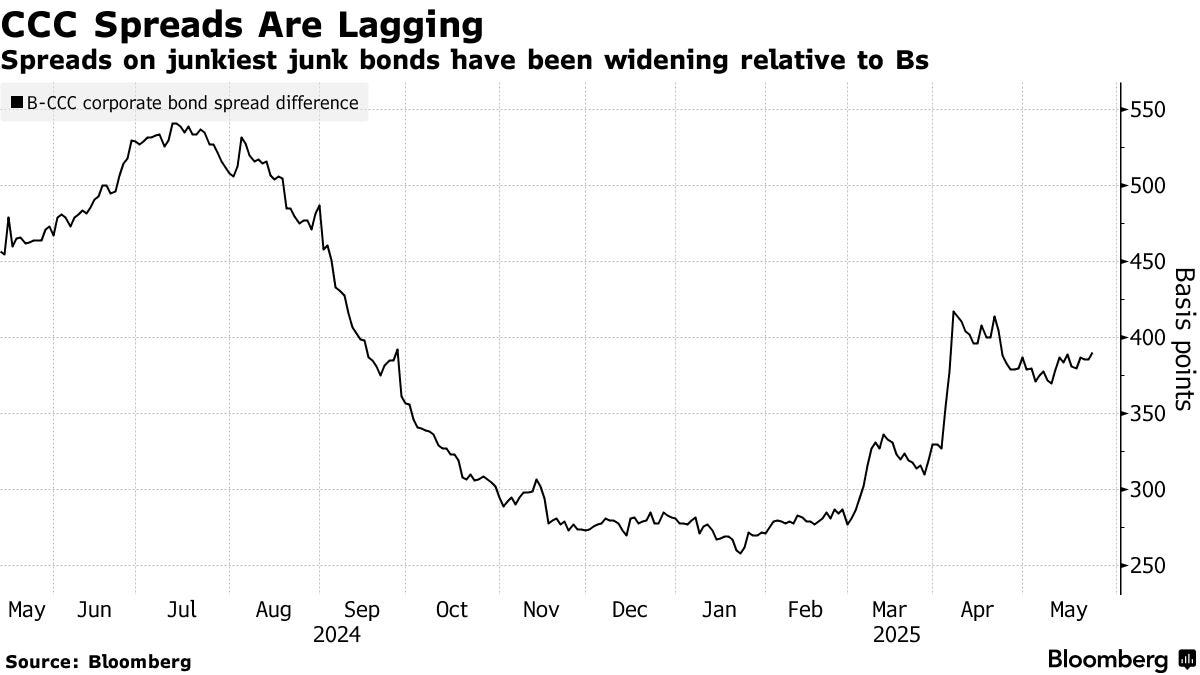
May 24, 2025 at 3:00 PM EDT Bloomberg: Junkiest Junk Is Offering a Warning Sign for Debt
… Jamie Dimon, chief executive officer of JPMorgan Chase & Co., and Josh Easterly, co-founder and co-chief investment officer of Sixth Street Partners, are among those warning that the credit market may not be pricing in enough risk. And the lowest rung of junk bonds are flashing warnings that the US economy could soon face slower growth and higher inflation, as well as the possibility of a recession.
Risk premiums on junk bonds rated in the CCC tier have widened 1.56 percentage points this year, and 0.4 percentage point in the latest week. The gap between spreads on CCCs and the next tier above them, Bs, has been widening this year and in the last two weeks, signaling that the weakest bonds are lagging.
The CCC widening and underperformance are red flags, said Connor Fitzgerald, fixed-income portfolio manager at Wellington Management, a firm that oversees more than $1 trillion of assets.
“I wouldn’t recommend somebody make a big move into high yield today, because spreads are tight and if you think there’s concern about a recession, you risk default-related losses,” Fitzgerald said in an interview.
Dimon, who was early to spot risks in the mortgage market during the US housing bubble, said on Monday that credit spreads aren’t accounting for the impacts of a potential downturn. He added that the chances of elevated inflation and stagflation are greater than people think and cautioned that America’s asset prices remain high.
Credit is a “bad risk,” Dimon said at JPMorgan’s investor day. “The people who haven’t been through a major downturn are missing the point about what can happen in credit.”
Yet investors are still buying at least some junk bonds. CoreWeave Inc., an AI cloud hosting firm, sold $2 billion of five-year notes on Wednesday, finding enough demand to boost the size of the offering from $1.5 billion. And in the US investment-grade market, companies sold more than $35 billion of bonds this week, topping dealers’ forecasts of around $25 billion…
… and added TO the coming weeks duration extension / needs (and mystery buyers) is some further food for thought …
May 24, 2025 WolfST: 30-Year & 20-Year Treasury Yields Back over 5%, 10-Year over 4.5%, Yield Curve Steepens at Long End, Mortgage Rates Back over 7%
Will the bond market eventually wake up and scare the bejesus out of Congress? Is it already rubbing its eyes?
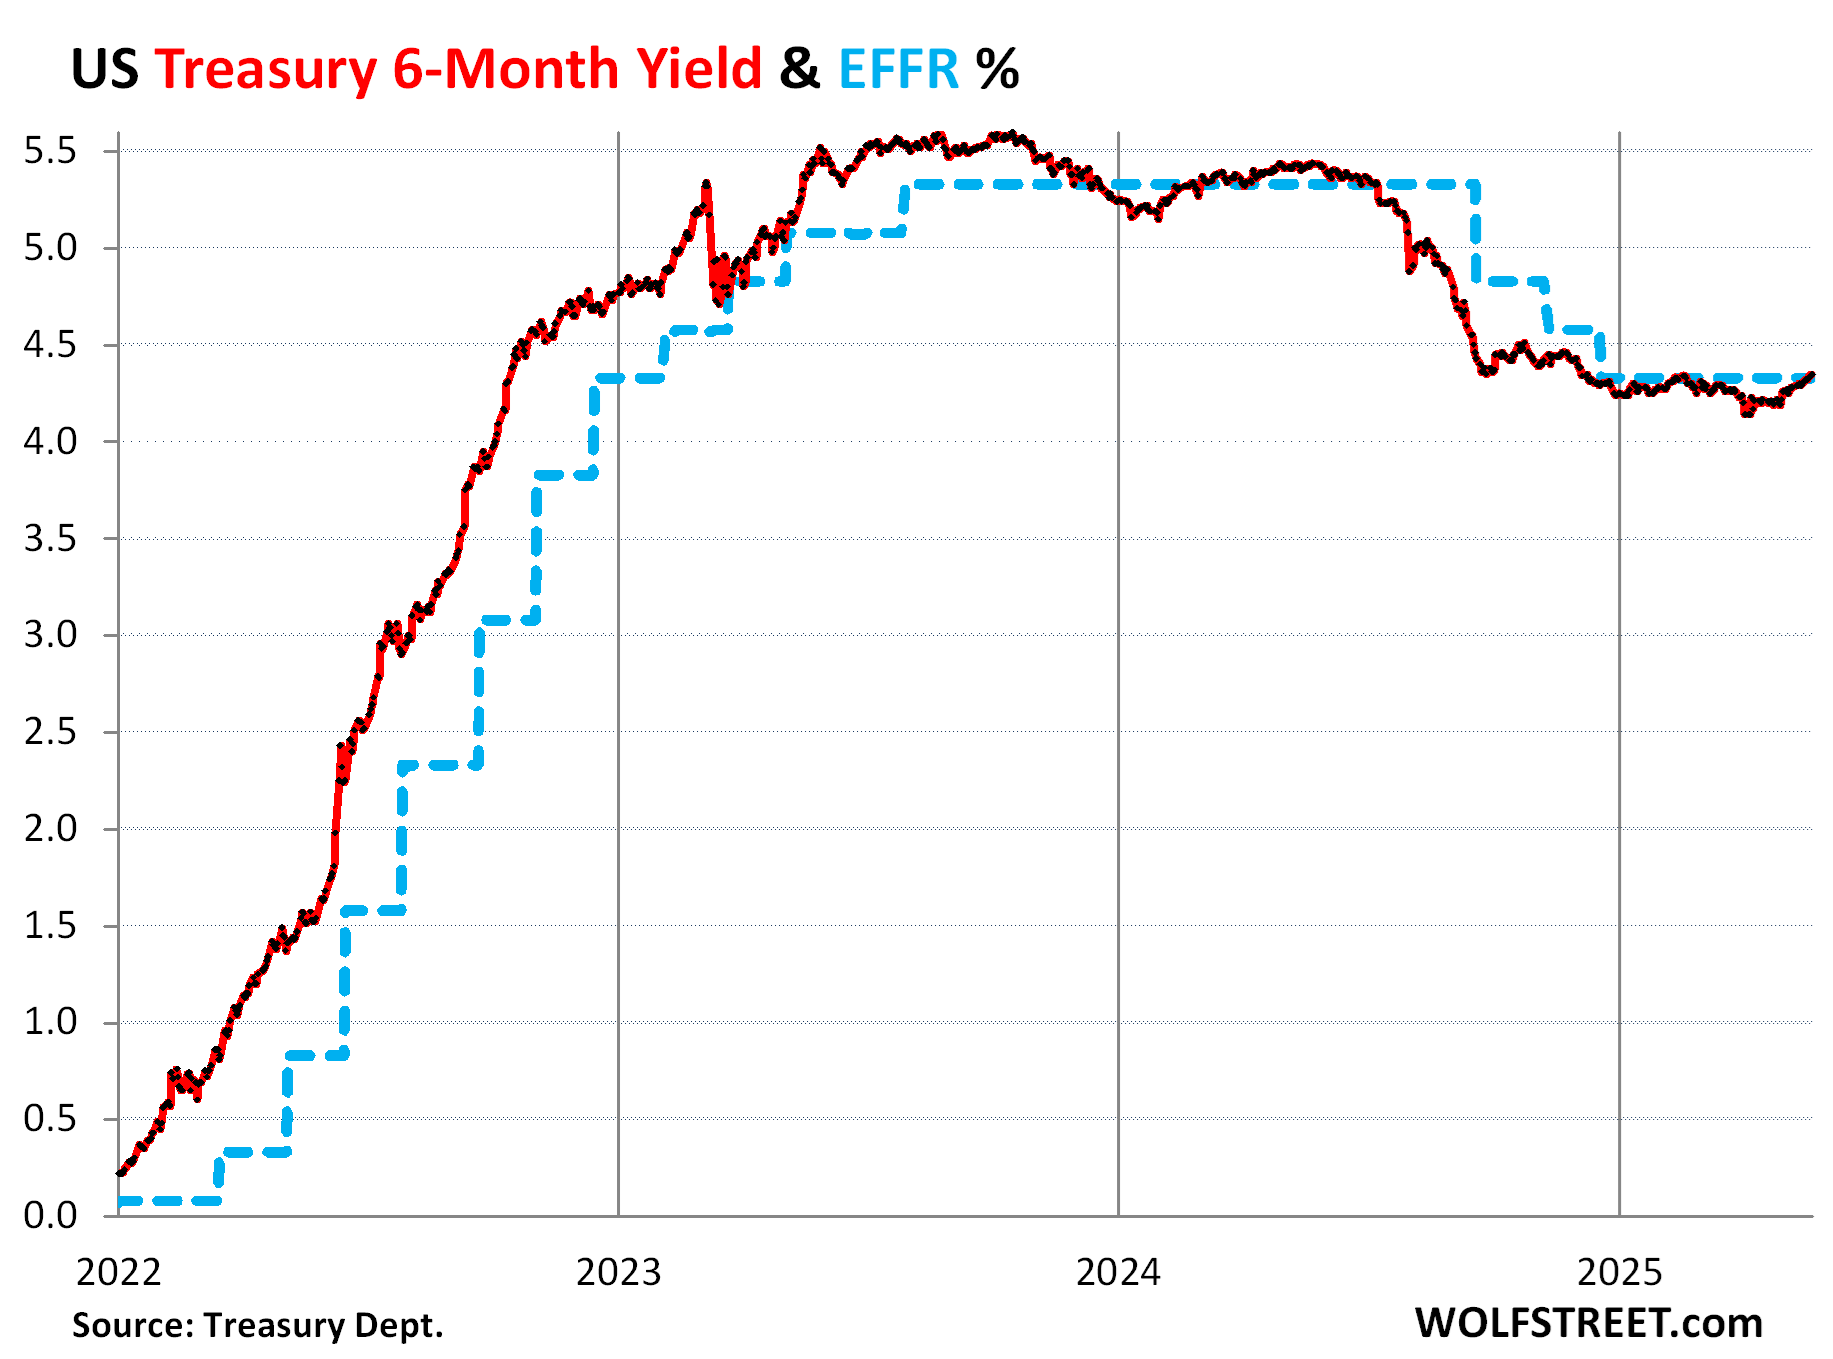
… The Fed started cutting its policy rates in mid-September 2024, by a total of 100 basis points so far. The Effective Federal Funds Rate, which the Fed targets with its policy rates, has dropped by 100 basis points, from 5.33% to 4.33% (blue line in the chart).
But over the same period since mid-September, the 30-year yield has surged by 110 basis points, in a spectacular counter-move (red in the chart). The gyrations around “Liberation Day” now look just like some additional squiggles in a longer up-trend.
…The 10-year Treasury yield ended Friday at 4.52%, after briefly kissing 4.61% on Thursday. So it’s back where it had been in February.
No rate cut for months: 6-month Treasury yield.
The six-month Treasury yield has taken rate cuts off the table within its window which extends to about three to four months. It normally does a pretty good job of anticipating rate hikes and cuts months in advance, as market participants listen to every comma the Fed utters or fails to utter.
It has ticked up by 20 basis points since early April and now hovers right at the EFFR, amid persistent chanting by the Fed and Fed governors of the wait-and-see mantra.
…All three issues – fears of higher inflation, fears of a lax Fed, and additional years of unspeakable fiscal madness – are anathema for the bond market.
Except that the bond market has been sleeping through the first few innings of this anathema. It briefly woke up in the second half of 2023, but then dozed off again. And now it woke up again? Maybe just a little?
The last time the bond market was wide awake, nervously watching inning after inning of anathema, was in the late 1970s through the early 1990s, when the 10-year yield was mostly above 8%, and for some years much higher.
Eventually, the bond market scared the bejesus out of Congress and the White House, and they successfully trimmed the deficit. The bond market scaring the bejesus out of Congress and the White House for years to come – not just a brief episode that blows over – is likely the only force that can get them to trim the deficit. But that’s not happening right now.
… THAT is all for now. Back IF / when I stumble on anything else but for now … Enjoy whatever is left of YOUR long weekend …